 |
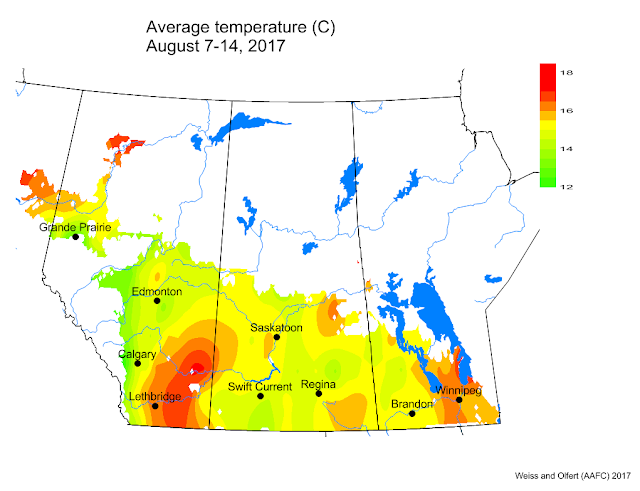
| Figure 1. Average precipitation across the Canadian prairies the past seven days (August 7-14, 2017). |
 |
| Figure 2. Average temperature across the Canadian prairies the past 30 days (July 14-August 14, 2017). |
After a fair bit heat across the prairies (Fig. 3), a few of us woke to cooler temperatures (Fig. 4) this week!
 |
| Figure 3. Highest temperatures the past seven days (August 10-16, 2017) across the Canadian prairies. |
 |
| Figure 4. Lowest temperatures the past seven days (August 10-16, 2017) across the Canadian prairies. |
Precipitation - Seven-day rainfall accumulations were greatest in regions north of the Yellowhead highway (Fig. 5). Total 30-day rainfall accumulations indicate that conditions dryer than normal for most of the prairies, particularly southern and central regions of Alberta (Fig. 6).
 |
| Figure 5. Accumulated precipitation the past seven days (August 7-13, 2017). |
 |
| Figure 6. Percent of average precipitation across the Canadian prairies the past 30 days (July 15-August 13, 2017). |
This growing season (April 1 – August 13, 2017), the percent of average precipitation continues to be below average for most of the prairies (Fig. 7).
 |
| Figure 7. Percent of average precipitation across the Canadian prairies for the growing season (April 1-August 13, 2017). |
The growing degree day map (GDD) (Base 10ºC, March 1 – August 13, 2017) is below:
The growing degree day map (GDD) (Base 5ºC, March 1 – August 13, 2017) is below:
The maps above are all produced by Agriculture and Agri-Food Canada. Growers may wish to bookmark the AAFC Drought Watch Maps for the growing season.

