Saturday 27 April 2019

Weekly Update (Apr 26, 2019; Wk 3) Otani, Giffen, Weiss, Trudel, Olfert, Vankosky

Greetings!

We shift back into the more traditional end of the week release of the "Weekly Update".  

Thanks to David Giffen and Ross Weiss (AAFC-Saskatoon) who again have begun to stream data that enables the generation of the various predictive model updates on a weekly basis throughout the growing season.  This week, their efforts include pea leaf weevil, alfalfa weevil, and grasshopper predictive model outputs.

Access the complete Weekly Update either as a series of Posts for Week 3 (April 26, 2019) OR downloadable PDF version.

Good luck with your field scouting!


Questions or problems accessing the contents of this Weekly Update?  Please e-mail either Dr. Meghan Vankosky or Jennifer Otani.  Past “Weekly Updates” can be accessed on our Weekly Update page.

Subscribe to the Blog by following these easy steps!

Weather synopsis (April 24, 2019; Wk 3)

Weather synopsis – Temperatures (30 day average) have been warmest in southern AB and western SK. 

Rainfall (30 day accumulation) amounts have been well below average for most of the prairies. 


Percent of normal precipitation for the past 30 days (as of April 23, 2019) across the Canadian prairies.
Image has not been reproduced in affiliation with, or with the endorsement of the Government of Canada and was retrieved (24Apr2019). 
Access the full map at http://www.agr.gc.ca/DW-GS/current-actuelles.jspx?lang=eng&jsEnabled=true


The soil moisture model indicates that soil moisture levels are low across most of southern and central AB and western SK. 


Wind Trajectories (Apr 26, 2019; Wk 3) Weiss, Vankosky, Trudel

Agriculture and Agri-Food Canada (AAFC) and Environment and Climate Change Canada (ECCC) have been working together to study the potential of trajectories for monitoring insect movements since the late 1990s. Trajectory models are used to deliver an early-warning system for the origin and destination of migratory invasive species, such as diamondback moth.  In addition, plant pathologists have shown that trajectories can assist with the prediction of plant disease infestations and are also beginning to utilize these same data. We receive two types of model output from ECCC: reverse trajectories and forward trajectories.

‘Reverse trajectories’ (RT) refer to air currents that are tracked back in time from specified Canadian locations over a five-day period prior to their arrival date.  Of particular interest are those trajectories that, prior to their arrival in Canada, originated over northwestern and southern USA and Mexico, anywhere diamondback moth populations overwinter and adults are actively migrating.  If diamondback adults are present in the air currents that originate from these southern locations, the moths may be deposited on the Prairies at sites along the trajectory, depending on the local weather conditions at the time that the trajectories pass over our area (e.g. rain showers, etc.). Reverse trajectories are the best available estimate of the ''true'' 3D wind fields at a specific point. They are based on observations, satellite and radiosonde data.

‘Forward trajectories’ (FT) have a similar purpose; however, the modelling process begins at sites in USA & Mexico. The model output predicts the pathway of a trajectory. Again, of interest to us are the winds that eventually end up passing over the Prairies.

Ross Weiss (AAFC), Meghan Vankosky (AAFC) and Serge Trudel (ECCC)


DATE: APRIL 24, 2019

Reverse trajectories (RT)
a. Pacific Northwest (PNW) – For the period of April 17-23, 2019, there have been 55 RT’s (originating over ID, OR and WA) that have crossed over prairie locations (Figs. 1 and 2).  By comparison, for the period of April  10-16, 2019, there were 31 RT’s. The majority PNW RT’s have been reported to pass over southern AB.  Since March 23rd, Lethbridge AB has reported the highest number of PNW RT’s (n=20), Beiseker AB  (n=15) and Gainsborough SK (n=11).

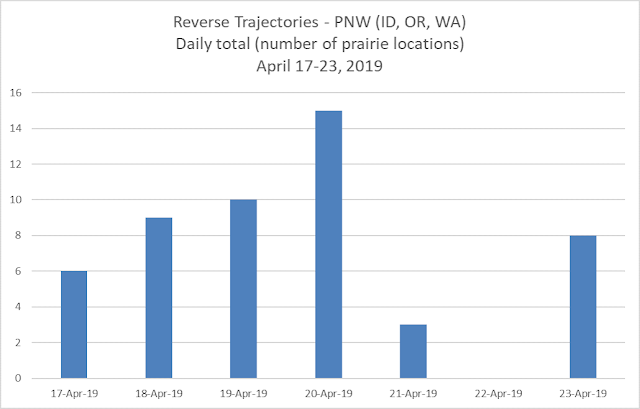
Figure 1.  Daily total number of reverse trajectories originating over ID, OR, and WA that have crossed the prairies.

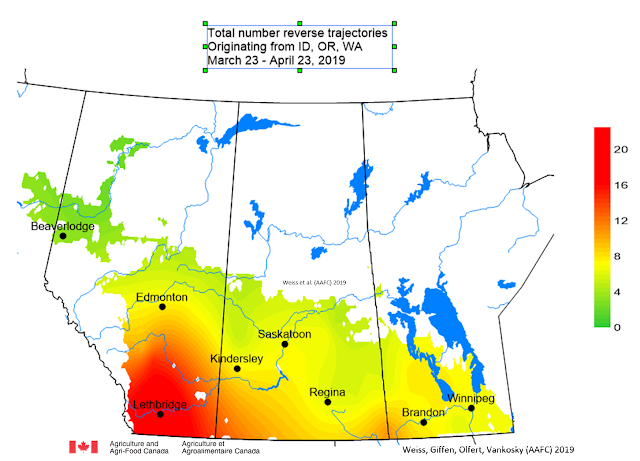
Figure 2. Total number of dates with PNW reverse trajectories originating over ID, OR, and WA that have crossed the prairies (since March 23, 2019).

b. Mexico and SW USA (TX, CA) – No trajectories, originating over Mexico or southwest USA have crossed the prairies for the period of April 17-23, 2019. Since March 23, 2019 there have been 5 reverse trajectories that originated over Mexico, CA and TX. All five occurred on April 7, 2019.

c. Texas and Oklahoma – No trajectories, originating over TX or OK have crossed the prairies for the period of April 17-23, 2019.  Since March 23, 2019 there have been 18 reverse trajectories that have originated over OK and TX (Fig. 3). Most of these trajectories have crossed eastern SK and MB.
Figure 3.  Total number of dates with reverse trajectories originating over OK and TX that have crossed the prairies (since March 23, 2019).


d. Nebraska and Kansas - No trajectories, originating over KS or NE have crossed the prairies for the period of April 17-23, 2019.  Since March 23, 2019 there have been 18 reverse trajectories that have originated over KS and NE (Fig. 4).

Figure 4. Total number of dates with reverse trajectories originating over KS and NE that have crossed the prairies (since March 23, 2019).


In a continuing effort to produce timely information, wind trajectory reports will be available both DAILY and WEEKLY:

Pea leaf weevil (Apr 24, 2019; Wk 3)

Pea Leaf Weevil (Sitona lineatus– The PLW model was run for Lethbridge AB (Fig. 1) and Saskatoon SK (Fig. 2). Output suggests that PLW are beginning to become active. 

Figure 1. Predicted PLW phenology at  Lethbridge AB based on long term climate data.
Values are based on model simulations (April 1 – April 23, 2019).


Figure 2. Predicted PLW phenology at Saskatoon SK based on long term climate data.
Values are based on model simulations (April 1 – April 23, 2019).

Pea leaf weevils emerge in the spring primarily by flying (at temperatures above 17ÂșC) or they may walk short distances. Pea leaf weevil movement into peas and faba beans is achieved primarily through flight.  Adults are slender, greyish-brown measuring approximately 5 mm in length (Fig. 3, Left).  

The pea leaf weevil resembles the sweet clover weevil (Sitona cylindricollis) but the former is distinguished by three light-coloured stripes extending length-wise down thorax and sometimes the abdomen.  All species of Sitona, including the pea leaf weevil, have a short snout.  


Figure 3  Comparison images and descriptions of four Sitona species adults including pea leaf weevil (Left).

Adults will feed upon the leaf margins and growing points of legume seedlings (alfalfa, clover, dry beans, faba beans, peas) and produce a characteristic, scalloped (notched) edge.  Females lay 1000 to 1500 eggs in the soil either near or on developing pea or faba bean plants from May to June.


Reminder - The risk map for pea leaf weevils was released in March 2019.  The map is based on the number of feeding notches observed in peas (Fig. 4).  


Figure 4. Estimates of pea leaf weevil (S. lineatus) densities based on feeding notches observed in peas grown in Alberta and Saskatchewan in 2018.


Biological and monitoring information related to pea leaf weevil in field crops is posted by the province of Alberta and in the PPMN monitoring protocol.

Also refer to the pea leaf weevil page within the "Field Crop and Forage Pests and their Natural Enemies in Western Canada: Identification and management field guide" - both English-enhanced or French-enhanced versions are available.  A review of this insect was published in 2011 in Prairie Soils and Crops by Carcamo and Vankosky.

Alfalfa weevil (Apr 24, 2019; Wk 3)

Alfalfa Weevil (Hypera postica) – Degree-day maps of base 9°C are produced using the Harcourt/North Dakota models (Soroka et al. 2015).  Models predicting the development of Alfalfa weevil (Hypera postica) across the prairies are updated weekly to help growers time their in-field scouting for second-instar larvae. Compare the following predicted development stages and degree-day values from Soroka (2015) to the map below (Fig. 1).  

Alfalfa weevil (AAW) model runs indicate that oviposition may have begun in fields near Swift Current SK.


The larval stage of this weevil feeds on alfalfa leaves in a manner that characterizes the pest as a “skeletonizer”.  The green larva featuring a dorsal, white line down the length of its body has a dark brown head capsule and will grow to 9mm long.  


Alfalfa growers are encouraged to check the Alfalfa Weevil Fact Sheet prepared by Dr. Julie Soroka (AAFC-Saskatoon).  Additional information can be accessed by reviewing the Alfalfa Weevil Page extracted from the "Field crop and forage pests and their natural enemies in western Canada - Identification and management field guide" (Philip et al. 2015).  The guide is available in both a free English-enhanced or French-enhanced version.

Predicted grasshopper development (Apr 24, 2019; Wk 3)

Grasshopper Simulation Model Output – The grasshopper simulation model will be used to monitor grasshopper development across the prairies. Weekly temperature data collected across the prairies is incorporated into the simulation model which calculates estimates of grasshopper development stages based on biological parameters for Melanoplus sanguinipes (Migratory grasshopper).  

Model runs were conducted for Lethbridge AB and Saskatoon SK.  As of April 23, 2019, predicted development was 57% for both locations and is similar to long term average values. The following graph illustrates that gradual development has occurred during the past three weeks. Hatch is expected to occur in mid to late May.


More information can be found by accessing the grasshopper pages within the new "Field Crop and Forage Pests and their Natural Enemies in Western Canada: Identification and management field guide" as an English-enhanced or French-enhanced version.

Ticks and Lyme Disease (Apr 26, 2019; Wk 3)

As the spring weather improves and people are active outdoors, remember to watch for ticks  Blacklegged (deer) ticks are important because they can carry Lyme Disease.  Continued surveillance activities conducted by Health Canada and the provinces remain important and you can help by identifying / removing / submitting your ticks!

Follow the links to learn more and to submit ticks if you live in British ColumbiaAlbertaSaskatchewanManitobaOntario, or Quebec.

Figure 1. Screenshot of Health Canada's map of Lyme disease endemic and risk areas in Canada as of 2016 (retrieved 24Apr2019).

Previous Posts (Apr 26, 2019; Wk 3)

The following is a list of 2019 Posts - click to review:

2019 Risk and forecast maps - Week 2

Wind trajectories - Week 2

Monday 15 April 2019

Weekly Update (Apr 15, 2019; Wk 2) Otani, Vankosky, Giffen, Weiss, Trudel, Mori, Olfert

Greetings!

This week we share the prairie-wide risk maps to prepare for the 2019 growing season and we continue to evolve how the wind trajectory data is available.  

Access the complete Weekly Update either as a series of Posts for Week 2 (April 15, 2019) OR downloadable PDF version.

Happy Easter!


Questions or problems accessing the contents of this Weekly Update?  Please e-mail either Dr. Meghan Vankosky or Jennifer Otani.  Past “Weekly Updates” can be accessed on our Weekly Update page.

Subscribe to the Blog by following these easy steps!!

Wind Trajectories (Apr 15, 2019; Wk 2) Weiss, Vankosky, Trudel

Agriculture and Agri-Food Canada (AAFC) and Environment and Climate Change Canada (ECCC) have been working together to study the potential of trajectories for monitoring insect movements since the late 1990s.

In a continuing effort to produce timely information, the wind trajectory reports will be available both DAILY and WEEKLY:

2019 Risk and Forecast Maps for the Prairies

The 2019 Prairie-Wide Risk and Forecast Maps can be viewed and downloaded here.

Economically significant insect pests are monitored across the Canadian prairies each year, thanks to extensive networks of collaborators and cooperators.  In 2018, that effort culminated in 5764 survey stops across Manitoba, Saskatchewan, Alberta and the BC Peace!  

Here's what's included in the PDF file:
  • Average tempature, average precipitation, and modeled soil moisture for 2018.
  • A series of geospatial maps are included for each of the target species; the current map is followed by the previous 4 years.  
  • For some species, the geospatial maps represent 2018 distributions used to infer risk in the coming 2019 growing season.  Data is included for bertha armyworm, cabbage seedpod weevil, pea leaf weevil, wheat stem sawfly and diamondback moth.
  • For wheat midge and grasshoppers, the geospatial maps forecast or predict expected populations or risk for the 2019 growing season.  
The historical Risk and Forecast Maps (2015-2019) are available for review.  

These maps help the agricultural industry prepare to manage insect pests across the prairies and helps growers make crop choices and anticipate scouting priorities within their growing region.  From May to July, the Weekly Updates will provide in-season updates, predictive model outputs plus scouting tips and links to relevant information.  

Thank you to the many people who monitor each growing season!


2018 Swede Midge Pheromone Monitoring Results - Mori, Vankosky

In 2018, swede midge pheromone traps were deployed at 41 sites across the Prairie region of Canada to monitor adult populations of this brassica pest. Of the 41 trap sites, 16 were located in Alberta, 19 in Saskatchewan (where positive swede midge identifications were made in 2007 and 2009), and 6 in Manitoba.

None of the traps were positive for swede midge in 2018. 

We are grateful to all of the producers, agronomists, and cooperators who participated in the 2018 swede midge monitoring project. Without your assistance, we could not have supported such a thorough and widespread pheromone monitoring program.

We also extend our thanks to Jonathon Williams for organizing the program, distributing trapping materials, and processing returned sticky cards for adult swede midge.

Because of the serious threat that swede midge poses to canola production, it is vital that monitoring for swede midge continues across the Prairies. At this time, plans are being made for the 2019 swede midge monitoring program. We hope that we can count on your support and cooperation in 2019.

At this time, plans are being made for the 2019 swede midge monitoring program. Agrologists or growers interested in performing weekly monitoring in 2019 are encouraged to contact Jonathon Williams, Boyd Mori, or Meghan Vankosky for more information.

Boyd Mori and Meghan Vankosky

Agriculture and Agri-Food Canada, Saskatoon Research and Development Centre

More information about swede midge can be found by:

• Referring to the Canola Watch article by Dr. Julie Soroka or accessing a new Ontario fact sheet produced by Baute et al. 2016.
• Accessing the swede midge pages within the new Field Guide which is available as a free download in either English or French.


Monday 8 April 2019

Weekly Update (Apr 08, 2019; Wk 1) Otani, Vankosky

Greetings!

We're back for the 2019 growing season!  


April's information will focus on wind trajectories related to the prairie provinces.  This is an important tool used to track potential arrival events for pest species moving northerly into the Canadian prairies from more southerly points of origin (e.g., diamondback moth, aster leafhoppers).

Access the complete Weekly Update either as a series of Posts for Week 1 (April 8, 2019) OR downloadable PDF version.

Happy Spring!


Questions or problems accessing the contents of this Weekly Update?  Please e-mail either Dr. Meghan Vankosky or Jennifer Otani.  Past “Weekly Updates” can be accessed on our Weekly Update page.

Subscribe to the Blog by following these easy steps!

Wind Trajectories (Apr 08, 2019; Wk 1) Weiss, Vankosky, Trudel

Agriculture and Agri-Food Canada (AAFC) and Environment and Climate Change Canada (ECCC) have been working together to study the potential of trajectories for monitoring insect movements since the late 1990s. Trajectory models are used to deliver an early-warning system for the origin and destination of migratory invasive species, such as diamondback moth.  In addition, plant pathologists have shown that trajectories can assist with the prediction of plant disease infestations and are also beginning to utilize these same data. We receive two types of model output from ECCC: reverse trajectories and forward trajectories.

‘Reverse trajectories’ (RT) refer to air currents that are tracked back in time from specified Canadian locations over a five-day period prior to their arrival date.  Of particular interest are those trajectories that, prior to their arrival in Canada, originated over northwestern and southern USA and Mexico, anywhere diamondback moth populations overwinter and adults are actively migrating.  If diamondback adults are present in the air currents that originate from these southern locations, the moths may be deposited on the Prairies at sites along the trajectory, depending on the local weather conditions at the time that the trajectories pass over our area (e.g. rain showers, etc.). Reverse trajectories are the best available estimate of the ''true'' 3D wind fields at a specific point. They are based on observations, satellite and radiosonde data.

‘Forward trajectories’ (FT) have a similar purpose; however, the modelling process begins at sites in USA & Mexico. The model output predicts the pathway of a trajectory. Again, of interest to us are the winds that eventually end up passing over the Prairies.

Ross Weiss (AAFC), Meghan Vankosky (AAFC) and Serge Trudel (ECCC)


DATE: APRIL 8, 2019

1.  Reverse trajectories (RT):
a.  Pacific Northwest (PNW) – For the period of April 2-8 there have been 69 RT’s (originating over the PNW) that have crossed over prairie locations.  Since March 23rd  Lethbridge has reported the highest number of PNW RT’s (n=9), followed by Olds AB, Beiseker AB and Dauphin MB (n=6).

List of PNW Reverse trajectories that have crossed the prairies (Since March 23, 2019):


b.  Mexico and SW USA (SW) – On April 7 the first Southwestern USA and Mexico RT’s crossed the prairies. These reverse trajectories originated over TX and CA.


The following maps present two examples of April 7, 2019 RT’s. The first map indicates that the RT crossing Tisdale originated across southern TX. The second map shows that two RT’s crossed over Regina. The red line indicates that this RT originated over southern TX. A second RT originated across central CA.

Tisdale SK, April 7, 2019

Regina SK, April 7, 2019

2.  Forward trajectories (FT) – 

The following table reports the origin of forward trajectories predicted to cross the prairies over the next five days.  Forward trajectories, originating over Santa Maria, CA are predicted to pass over SK and MB in the next five days.