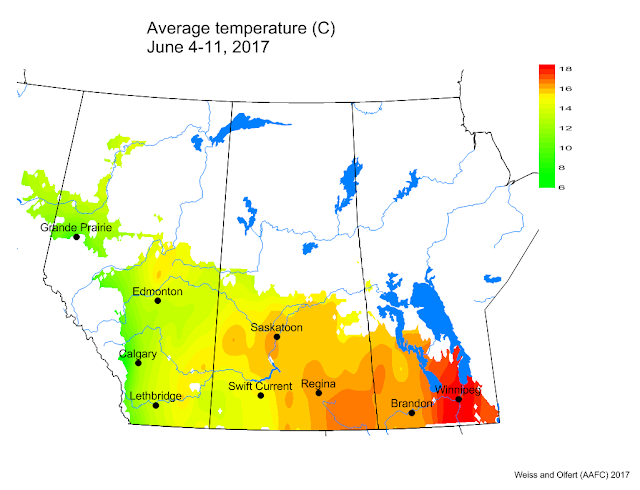
This second map presents the 30 Day Average Temperature. Average temperatures were greatest in southern regions of Manitoba and central Alberta.
The map below indicates that 7 Day Accumulated Precipitation was greatest across Alberta while central and southern Saskatchewan continued to be dry.
The map below indicates that the rainfall amounts for the past month (May 13 – June 11) were average to above-average in Alberta and below-average for Manitoba and Saskatchewan.
The updated growing degree day map (GDD) (Base 5ºC, March 1 – June 11, 2017) is below:
While the growing degree day map (GDD) (Base 10ºC, March 1 – June 11, 2017) is below:
The maps above are all produced by Agriculture and Agri-Food Canada. Growers may wish to bookmark the AAFC Drought Watch Maps for the growing season.


