Pages

Monday, 29 June 2020

Insect Pest of the Week and the Entomologists that Study Them (June 29): Sugar Beet Pests / Feature entomologist: James Tansey

This week’s Insect of the Week feature crop is the sugar beet, a plant that has been grown in southern Alberta since 1925. Our feature entomologist this week is James Tansey.

Sugar Beets cc by 2.0 Ulrike Leone

Note: 
This year, we're doing things a bit differently for our Insect of the Week. Instead of focussing on a single insect (pest or natural enemy), we're looking at it from a crop perspective. Each week, we'll pick a crop and list the insects that attack it along with additional helpful information. The insect list is based on the information found in the Field Crop and Forage Pests and their Natural Enemies in Western Canada: Identification and Management field guide. The field guide offers information describing lifecycle, damage description, monitoring/scouting strategies, economic thresholds (where available) and control options) for each economic pest.

In addition to an Insect of the Week, we'll also feature one of the entomologists that helps support the PPMN, either directly or indirectly.

Thursday, 25 June 2020

Weekly Update (June 25, 2020; Wk 09) Otani, Weiss, Rounce, Trudel, Svendsen, Mori, Turkington, Olfert, Vankosky

Time to transition to more insects in field crops - add a few more to your scouting list!

Access information to support your in-field insect monitoring efforts in the complete Weekly Update either as a series of Posts for Week 9 OR a downloadable PDF.

Stay Safe!


Questions or problems accessing the contents of this Weekly Update?  Please e-mail either Meghan.Vankosky@canada.ca or Jennifer.Otani@canada.ca.  Past “Weekly Updates” can be accessed on our Weekly Update page.

Subscribe to the Blog by following these easy steps!

Weather synopsis

Weather synopsis – This week (June 15-21, 2020) prairie temperatures were generally cooler than average and 7-day rainfall totals were marginally above average.  Average 7-day temperatures were warmest across Manitoba and the Peace River region (Table 1; Fig. 1).  Temperatures were coolest across most of Saskatchewan (Table 1; Fig. 1).  The weekly average temperature at Winnipeg (19 °C) was 6 °C warmer than at Regina (Table 1). 

Table 1. 7-day temperature and rainfall summary (June 15-21, 2020
Figure 1. Observed average temperatures across the Canadian prairies for the past seven days (June 15-21, 2020).

Average 30-day (May 23-June 21, 2020) temperatures continue to be cooler in Alberta than in Saskatchewan and Manitoba (Table 2; Fig. 2).  Temperature anomalies indicated that most of the prairies have been 0 to 2 °C cooler than average (Fig. 3).  Southern regions of Alberta and Manitoba have been 0 to 2 °C warmer than average (Fig. 3). 

Table 2. 30-day temperature and rainfall summary (May 16 -June 14, 2020)


Figure 2. Observed average temperatures across the Canadian prairies for the past 30 days (May 23-June 21, 2020).

Figure 3. Mean temperature difference from Normal across the Canadian prairies the past 30 days (May 26-June 22, 2020). Image has not been reproduced in affiliation with, or with the endorsement of the Government of Canada and was retrieved (22Jun2020). Access the full map at http://www.agr.gc.ca/DW-GS/current-actuelles.jspx?lang=eng&jsEnabled=true&reset=1588297059209  

This past week (June 8-14, 2020), rainfall amounts were greatest across central regions of Saskatchewan and eastern Manitoba. Thirty-day cumulative rainfall amounts vary across the prairies.  Conditions are driest across the southern prairies.  Total 30-day rainfall at Brandon, Regina and Lethbridge have been less than 51.5 mm.  Rainfall amounts have been greater across central regions of Alberta and Saskatchewan.  Lacombe has reported 94.4 mm (175% of normal) and Saskatoon has had 120.4 mm 262% of normal) in the past 30 days.
Figure 4. Observed cumulative precipitation across the Canadian prairies for the past seven days (June 15-21, 2020).

Figure 5. Observed cumulative precipitation across the Canadian prairies for the past 30 days (May 23-June 21, 2020).

Figure 6. Percent of average precipitation the past 30 days (May 26-June 22, 2020). Image has not been reproduced in affiliation with, or with the endorsement of the Government of Canada and was retrieved (22Jun2020). Access the full map at http://www.agr.gc.ca/DW-GS/current-actuelles.jspx?lang=eng&jsEnabled=true&reset=1588297059209

The growing degree day map (GDD) (Base 5 ºC, April 1-June 22, 2020) is below (Fig. 7):
Figure 7. Growing degree day map (Base 5 °C) observed across the Canadian prairies for the growing season (April 1-June 22, 2020). Image has not been reproduced in affiliation with, or with the endorsement of the Government of Canada and was retrieved (25Jun2020). Access the full map at http://www.agr.gc.ca/DW-GS/current-actuelles.jspx?lang=eng&jsEnabled=true&reset=1588297059209

The growing degree day map (GDD) (Base 10 ºC, April 1-June 22, 2020) is below (Fig. 8):
Figure 8. Growing degree day map (Base 10 °C) observed across the Canadian prairies for the growing season (April 1-June 22, 2020). Image has not been reproduced in affiliation with, or with the endorsement of the Government of Canada and was retrieved (25Jun2020). Access the full map at http://www.agr.gc.ca/DW-GS/current-actuelles.jspx?lang=eng&jsEnabled=true&reset=1588297059209

The highest temperatures (°C) observed the past seven days ranged from <15 to >30 °C in the map below (Fig. 9).
Figure 9. Highest temperatures (°C) observed across the Canadian prairies the past seven days (April 1-June 24, 2020). Image has not been reproduced in affiliation with, or with the endorsement of the Government of Canada and was retrieved (25Jun2020). Access the full map at http://www.agr.gc.ca/DW-GS/current-actuelles.jspx?lang=eng&jsEnabled=true&reset=1588297059209

While the map below reflects how many days >25 °C have occurred so far across the prairies as of June 24, 2020 (Fig. 10). 
Figure 10. Number of days with temperatures above 25 °C)observed across the Canadian prairies this growing season  (April 1-June 24, 2020). Image has not been reproduced in affiliation with, or with the endorsement of the Government of Canada and was retrieved (25Jun2020). Access the full map at http://www.agr.gc.ca/DW-GS/current-actuelles.jspx?lang=eng&jsEnabled=true&reset=1588297059209

The maps above are all produced by Agriculture and Agri-Food Canada.  Growers can bookmark the AAFC Current Conditions Drought Watch Maps for the growing season.  Historical weather data can be access at the AAFC Drought Watch websiteEnvironment Canada's Historical Data website, or your provincial weather network.

Wind Trajectories

Agriculture and Agri-Food Canada (AAFC) and Environment and Climate Change Canada (ECCC) have been working together to study the potential of trajectories for monitoring insect movements since the late 1990s.

The entire list of 2020 Wind Trajectory Reports is available here.
→ Read the WEEKLY Wind Trajectory Report for Wk10 (released June 22, 2020).

Diamondback moth

Diamondback moth (Plutellidae: Plutella xylostella) - Once diamondback moth is present in the area, it is important to monitor individual canola fields for larvae.  Warm growing conditions can quickly translate into multiple generations in a very short period!

Wind Trajectory Updates - Wind trajectory models used to deliver an early-warning system for the origin and destination of migratory invasive species indicated arrival events of air currents potentially carrying migrating diamondback moths from more southerly regions.  Access the Weekly Wind Trajectory Report (released June 22, 2020) to review where wind trajectories originating over Mexico, California, Texas or the Pacific Northwest cross locations in Manitoba, Saskatchewan, and Alberta.

Weekly Pheromone-baited Trapping Results - Early season detection of diamondback moth is improved through the use of pheromone-baited delta traps deployed in fields across the Canadian prairies.  Click each province to access moth reporting numbers observed in AlbertaSaskatchewan and Manitoba as they become available. Check these sites to assess cumulative counts and relative risk in your geographic region.

Monitoring:
Remove the plants in an area measuring 0.1 m² (about 12" square), beat them on to a clean surface and count the number of larvae (Fig. 1) dislodged from the plant. Repeat this procedure at least in five locations in the field to get an accurate count.


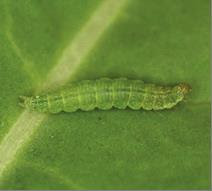
Figure 1. Diamondback larva measuring ~8 mm long.
Note brown head capsule and forked appearance of prolegs on posterior.


Figure 2. Diamondback moth pupa within silken cocoon.

Economic threshold for diamondback moth in canola at the advanced pod stage is 20 to 30 larvae/ 0.1  (approximately 2-3 larvae per plant).  Economic thresholds for canola or mustard in the early flowering stage are not available. However, insecticide applications are likely required at larval densities of 10 to 15 larvae/ 0.1  (approximately 1-2 larvae per plant).

Figure 3. Diamondback moth.

Biological and monitoring information for DBM is posted by Manitoba AgricultureSaskatchewan Agriculture, and the Prairie Pest Monitoring Network.  

More information about Diamondback moths can be found by accessing the pages from the  "Field Crop and Forage Pests and their Natural Enemies in Western Canada: Identification and Field Guide".  View ONLY the Diamondback moth page but remember the guide is available as a free downloadable document as both an English-enhanced or French-enhanced version.

Bertha armyworm monitoring

Bertha armyworm (Lepidoptera: Mamestra configurataModel simulations as of June 21, 2020, indicate that 69 % of the population is in the pupal stage (Fig. 1), 26% in the adult stage (Fig. 2) and 5 % is predicted to be in the egg stage (Fig. 3).  Across the Parkland and Peace River regions, BAW populations are predicted to be predominantly in the pupal stage (Fig. 1).  Last week BAW adults were predicted to occur in isolated areas across the southern prairies (Fig. 2).  This week adults should be collected in BAW traps across south and central regions of the prairies.  Eggs may be occurring in southern regions (Fig. 3).  
Figure 1. Predicted percent of bertha armyworm (Mamestra configurata) population at pupal stage as of June 21, 2020

Figure 2. Predicted percent of bertha armyworm (Mamestra configurata) population at adult stage as of June 21, 2020


Figure 3. Predicted percent of bertha armyworm (Mamestra configurata) population at egg stage as of June 21, 2020

The BAW model was run until June 30, 2020 to project developmental status. The simulations for Saskatoon (Fig. 4) and Brandon (Fig. 5) indicate that first occurrence of BAW larvae may begin later next week


Figure 4. Projected bertha armyworm (Mamestra configurata) phenology at Saskatoon SK as of June 30, 2020.


Figure 5. Projected bertha armyworm (Mamestra configurata) phenology at Brandon MB as of June 30, 2020.

Weekly Pheromone-baited Trapping Results - Early season detection of bertha armyworm is improved through the use of pheromone-baited unitraps traps deployed in fields across the Canadian prairies.  Click each province to access moth reporting numbers observed in Alberta, Saskatchewan and Manitoba as they become available. Check these sites to assess cumulative counts and relative risk in your geographic region.

Biological and monitoring information related to bertha armyworm in field crops is posted by the provinces of ManitobaSaskatchewanAlberta and the Prairie Pest Monitoring Network. Also refer to the bertha armyworm pages within the "Field Crop and Forage Pests and their Natural Enemies in Western Canada: Identification and management field guide" which is a free downloadable document as both an English-enhanced or French-enhanced version.

Refer to the PPMN Bertha armyworm monitoring protocol for help when performing in-field scouting.  Use the images below (Fig. 6) to help identify egg masses and the economically important larvae in canola.  Review the 2019 Insect of the Week which featured bertha armyworm and its doppelganger, the clover cutworm!


Figure 6. Stages of bertha armyworm from egg (A), larva (B), pupa (C) to adult (D).
Photos: J. Williams (Agriculture and Agri-Food Canada)

Predicted grasshopper development

Grasshopper Simulation Model Output – The grasshopper simulation model will be used to monitor grasshopper development across the prairies. Weekly temperature data collected across the prairies is incorporated into the simulation model which calculates estimates of grasshopper development stages based on biological parameters for Melanoplus sanguinipes (Migratory grasshopper). 

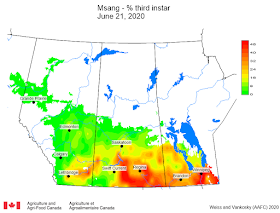
As of June 21, 2020, the grasshopper model estimates that hatch varies between 15.7 % at Lacombe to more than 95 % at Winnipeg and Regina (Table 1).  The prairie average is 71 % (34 % last week) and well above the long term average of 25 % (10 % last week) (Fig. 1).  Across the prairies, populations are predicted to be 22, 20, 29, 24 and 5 % in egg, first, second, third, and fourth instars, respectively (Table 1).  Warmer conditions across southern regions of the prairies should result in rapid development of first and second instar nymphs (Fig. 2).  This will result in most populations consisting of third instar nymphs within a relatively short period of time (Fig. 3).  

Table 1.  Predictive model output estimates for Melanoplus sanguinipes development (% of total population for each location) at selected sites across the Canadian prairie as of June 21, 2020.


Figure 1. Grasshopper hatch (%) based on model simulations using current environmental conditions (blue bars) compared to long-term normal (red bars) as of June 21, 2020.
*LTN = long term climate normals, used for comparison of current year development (OBS)
Figure 2. Predicted grasshopper (Melanoplus sanguinipes) development across
the Canadian prairies (as of June 21, 2020). 

Figure 3. Predicted percent of grasshopper (Melanoplus sanguinipes) population at third instar stage across
the Canadian prairies (as of June 21, 2020). 

The two graphs below compare grasshopper development at Saskatoon and Winnipeg.  Though both locations are predicted to have first to fourth instar nymphs, grasshopper populations near Saskatoon are expected to be predominantly in the first instar and populations near Winnipeg may consist mostly of third instars. 


Figure 4. Predicted grasshopper (Melanuplus sanguinipes) phenology at Saskatoon SK.
Values are based on model simulations (April 1-June 21, 2020).


Figure 5. Predicted grasshopper (Melanuplus sanguinipes) phenology at Winnipeg MB.
Values are based on model simulations (April 1-June 21, 2020).

Biological and monitoring information related to grasshoppers in field crops is posted by Manitoba AgricultureSaskatchewan AgricultureAlberta Agriculture and Forestry, the BC Ministry of Agriculture and the Prairie Pest Monitoring Network.  Also refer to the grasshopper pages within the "Field Crop and Forage Pests and their Natural Enemies in Western Canada: Identification and management field guide" (Philip et al. 2018) as an English-enhanced or French-enhanced version.

Predicted wheat midge development

Wheat Midge (Sitodiplosis mosellana Wheat midge overwinter as larval cocoons in the soil.  Soil moisture conditions in May and June can have significant impact on wheat midge emergence.  Adequate rainfall promotes termination of diapause and movement of larval to the sol surface where pupation occurs.  Insufficient rainfall in May and June can result in delayed movement of larvae to the soil surface. Elliott et al. (2009) reported that wheat midge emergence was delayed or erratic  if rainfall did not exceed 20-30 mm during May.  Olfert et al. (2016) ran model simulations to demonstrate how rainfall impacts wheat midge population density. Our wheat midge model (Olfert et al. 2020) indicates that dry conditions may result in:
    a. Delayed adult emergence and oviposition 
    b. Reduced numbers of adults and eggs

As of June 21, 2020, wheat midge model runs indicate that recent rainfall in Manitoba should result in development of wheat midge larvae (between Brandon and Winnipeg).  These larvae (in the soil) are expected to be moving to the soil surface.  Dry conditions across eastern Saskatchewan has delayed development of larval cocoons.  Pupae are predicted to be appearing across Alberta.  
Figure 1. Predicted  percent of larval population of wheat midge (Sitodiplosis mosellana) at soil surface across
the Canadian prairies (as of June 21, 2020).


Figure 2. Predicted  percent of population of wheat midge (Sitodiplosis mosellana) at pupal stage across
the Canadian prairies (as of June 21, 2020).

The following graph illustrates that adult wheat midge populations in the Saskatoon area are expected to emerge on June 30th.  Peak adult numbers are predicted to peak in mid July.  Females lay eggs on developing wheat heads. This typically occurs in the evening when winds are calm.  The wheat midge monitoring protocol suggests that wheat fields should be inspected for adults in late June and early July as wheat heads are emerging.  


Figure 3. Projected wheat midge (Sitdiplosis mosellana) phenology at Saskatoon SK as of June 30, 2020.

The following table provides an estimate of first occurrence of wheat midge adults and can be used as a guide to determine when fields should be monitored. 

Information related to wheat midge biology and monitoring can be accessed by linking to your provincial fact sheet (Saskatchewan Agriculture or Alberta Agriculture & Forestry).  A review of wheat midge on the Canadian prairies was published by Elliott, Olfert, and Hartley in 2011.  

Alberta Agriculture and Forestry has a YouTube video describing in-field monitoring for wheat midge.  

More information about Wheat midge can be found by accessing the pages from the new "Field Crop and Forage Pests and their Natural Enemies in Western Canada: Identification and Field Guide".  View ONLY the Wheat midge pages but remember the guide is available as a free downloadable document as both an English-enhanced or French-enhanced version.

Predicted pea leaf weevil development

Pea Leaf Weevil (Sitona lineatus–  As of June 21, 2020model runs for pea leaf weevil (PLW) indicate that oviposition has peaked at Swift Current and Lacombe.  The following two graphs illustrate that larval numbers continue to increase at Swift Current and Lacombe as the eggs continue to hatch.
Figure 1. Predicted pea leaf weevil (Sitona lineatus) phenology at Swift Current SK.
Values are based on model simulations (April 1-June 21, 2020).

Figure 2. Predicted pea leaf weevil (Sitona lineatus) phenology at Lacombe AB.
Values are based on model simulations (April 1-June 21, 2020).

Pea leaf weevils emerge in the spring primarily by flying (at temperatures above 17 ºC) or they may walk short distances. Pea leaf weevil movement into peas and faba beans is achieved primarily through flight.  Adults are slender, greyish-brown measuring approximately 5 mm in length (Fig. 3, Left).  

The pea leaf weevil resembles the sweet clover weevil (Sitona cylindricollis) but the former is distinguished by three light-coloured stripes extending length-wise down thorax and sometimes the abdomen.  All species of Sitona, including the pea leaf weevil, have a short snout.  


Figure 3.  Comparison images and descriptions of four Sitona species adults including pea leaf weevil (Left).

Adults will feed upon the leaf margins and growing points of legume seedlings (alfalfa, clover, dry beans, faba beans, peas) and produce a characteristic, scalloped (notched) edge.  Females lay 1000 to 1500 eggs in the soil either near or on developing pea or faba bean plants from May to June.


Larvae develop under the soil and are “C” shaped and milky-white with a dark-brown head capsule ranging in length from 3.5-5.5 mm (Figure 4).  Larvae develop through five instar stages.  After hatching, larvae seek and enter the roots of a pea plant.  Larvae will enter and consume the contents of the nodules of the legume host plant. It is the nodules that are responsible for nitrogen-fixation which affect yield plus the plant’s ability to input nitrogen into the soil. Consumption of or damage to the nodules (Figure 5) results in partial or complete inhibition of nitrogen fixation by the plant and results in poor plant growth and low seed yields.


Figure 4. Weevil larva in soil (Photo: L. Dosdall).


Figure 5. Pea nodules damaged by larval feeding (Photo: L. Dosdall).

Biological and monitoring information related to pea leaf weevil in field crops is posted by the province of Alberta and in the PPMN monitoring protocol.

Also refer to the pea leaf weevil page within the "Field Crop and Forage Pests and their Natural Enemies in Western Canada: Identification and management field guide" - both English-enhanced or French-enhanced versions are available. 

Field Heroes

The Field Heroes campaign continues to raise awareness of the role of beneficial insects in western Canadian crops. Check the recently updated Field Heroes website for scouting guides, downloadable posters, and videos. Learn about these important organisms at work in your fields!  

Real Agriculture went live with a weekly Pest and Predators podcast series!
• Access Episode 1 - Do you know your field heroes?
• Access Episode 2 - An inside look at the Prairie Pest Monitoring Network.
• Access Episode 3 - How much can one wasp save you?
NEW- Access Episode 4 - Eat and be eaten — grasshoppers as pests and food

Access ALL the Field Heroes links here and be sure to follow @FieldHeroes!


Provincial Insect Pest Reports

Provincial entomologists provide insect pest updates throughout the growing season so link to their insect-related information: 

Manitoba's Crop Pest Updates for 2020 are available. Access the June 24, 2020 report. The
summary indicates t
here are, "some foliar insecticide applications for flea beetles in canola continued over the past week, although this seems to be coming to an end. Cutworm control continues, but is also decreasing. Grasshopper nymphs are present in high levels in some areas; control around field edges has begun and some full fields have been sprayed for grasshoppers."


•  Alberta Agriculture and Forestry's Agri-News occasionally includes insect-related information. Read about Dutch elm disease awareness week (June 22-28), overwintered canola and ground beetles.  

Crop reports

Click the provincial ministry name below to link to online crop reports produced by:
• Manitoba Agriculture - Other viewing options include subscribing to receive or access a PDF of June 23, 2020 report.
• Saskatchewan Agriculture  or access a PDF of June 16-23, 2020 report.
• Alberta Agriculture and Forestry or access a PDF of June 16, 2020 report.

The following crop reports are also available:
• The United States Department of Agriculture (USDA) produces a Crop Progress Report (read the June 22, 2020 edition).